Study: Best Cities to Get Rich
READ MORE ABOUT FINANCIAL TIPS FOR YOUNG ADULTS
What does it take to get rich? Assuming you haven’t taken the two easiest routes — having wealthy parents or marrying into money — getting rich tends to require hard work, skill, and luck. And it doesn’t hurt to be in the right place at the right time. Some cities have job markets that reward talented people with eye-popping paychecks, and some are home to innovative industry clusters where startups can snag big venture capital money.
Study Methodology
Looking at the largest metropolitan areas in the U.S., we considered three factors:
- Percentage of high-income households
- Local economic growth
- Patents granted
We started by considering the percentage of households in each area with incomes of $150,000 a year or more. This data, from the U.S. Census Bureau, gives a sense of how common high-salary jobs are in a city. The average figure for the major urban areas we evaluated was about 10 percent.
Next, we considered how quickly the urban areas are growing. For this, we used gross domestic product numbers from the Bureau of Economic Analysis, considering growth from 2008 to 2011. On average, the places we looked at grew by 5.3 percent over that time.
Finally, as innovation is a big way many people get rich, we looked at the number of patents granted in each area in 2011, using data from the U.S. Patent and Trademark Office. For that year, the average number granted in our pool of urban areas was 1,484.
10 Best Cities to Get Rich
 |
1. San Jose, CA
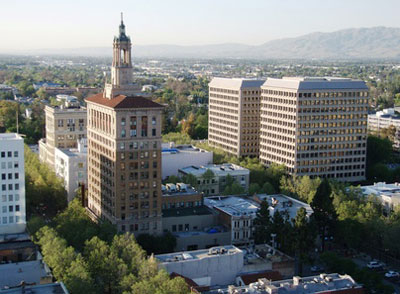 |
| SAN JOSE, CALIFORNIA |
- High Income Percentage: 25.1%
- GDP Growth: 18%
- Patents: 10,256
There was really no contest for first place on this list. San Jose swept away the competition, placing first in all three measures. This high-tech city took in more than 10,000 patents in 2011, grew more than three times faster than the average metro area, and has more than a quarter of households in the highest income brackets.
2. Boston, MA
 |
| BOSTON, MASSACHUSETTS |
- High Income Percentage: 16.8%
- GDP Growth: 9.1%
- Patents: 4,537
Boston has a reputation as the home of old money, but it has plenty of new money coming in, as well, demonstrated by the 9.1 percent growth it experienced between 2008 and 2011. In addition, nearly 17 percent of local households make $150,000 or more. It’s also an innovative area, ranking fifth in the number of patents received.
3. Washington, DC
 |
| WASHINGTON, DC |
- High Income Percentage: 23.6%
- GDP Growth: 9%
- Patents: 1,790
Known more for high-paid lobbyists than creative entrepreneurs, the DC area ranked 16th in number of patents but came in second for high-income households, with nearly a quarter of homes falling into that category. The area’s economy also grew by an impressive 9 percent.
4. Austin, TX
 |
| AUSTIN, TEXAS |
- High Income Percentage: 10.9%
- GDP Growth: 11.4%
- Patents: 2,460
With an economic base that includes high-tech companies and manufacturers, Austin grew more than twice as fast as the average metro area between 2008 and 2011, and it placed an impressive 11th in the number of patents granted. The area doesn’t stand out as much for the percentage of high-earning households, but at 10.9 percent, it’s still a bit higher than the average.
5. Minneapolis, MN
 |
| MINNEAPOLIS, MINNESOTA |
- High Income Percentage: 11.1%
- GDP Growth: 7.45%
- Patents: 3,113
Minneapolis and its surrounding communities help drive the Midwest’s economy, and it’s an area that has been doing better than the country as a whole in recent years. As one of the United States’ non-coastal innovation centers, this region placed 8th in the number of patents granted and 13th in economic growth. About 11 percent of local households make $150,000 or more.
6. New York
 |
| NEW YORK, NEW YORK |
- High Income Percentage: 16.1%
- GDP Growth: 5.1%
- Patents: 6,252
If you can make it here…well, you know. The traditional mecca for anyone with ambition retains its reputation, ranking fifth for high-income households. The local economy has grown at a respectable — if not eye-popping — 5.1 percent, and it ranks 6th for the number of patents granted.
7. Seattle, WA
 |
| SEATTLE, WASHINGTON |
- High Income Percentage: 12.7%
- GDP Growth: 5.6%
- Patents: 3,597
The rainy Northwest once had a reputation as a gathering place for the less ambitious, but that’s no longer true in Seattle: this area comes in at 8th place for the percentage of households making $150,000 or more. Home to household name brands like Amazon, Seattle also places 6th for the number of patents granted, and its economic growth has been a bit above average at 5.6 percent.
8. San Francisco, CA
 |
| SAN FRANCISCO, CALIFORNIA |
- High Income Percentage: 20%
- GDP Growth: 4%
- Patents: 6,468
When it comes to salaries, the San Francisco area is right near the top of the pack, with 20 percent of households in high-income brackets. The region also places second when it comes to patents granted. San Francisco would have ended up even higher on our list if it hadn’t been for its below-average economic growth, an increase of just 4 percent from 2008 to 2011.
9. (tie) Houston, TX
 |
| HOUSTON, TEXAS |
- High Income Percentage: 11.7%
- GDP Growth: 6%
- Patents: 6,468
Like fellow Texas powerhouse Austin, Houston had more than 2,000 patents granted in 2011, demonstrating its innovation bona fides. Its economic growth wasn’t quite as impressive, but at 6 percent, this figure is still above average. And this urban area has more than its fair share of high-income households with nearly 12 percent bringing in $150,000 or more.
9. (tie) Raleigh, NC
 |
| RALEIGH, NORTH CAROLINA |
- High Income Percentage: 11.3%
- GDP Growth: 10.2%
- Patents: 1,197
The only Southeastern area on this list, Raleigh had a very impressive level of economic growth in recent years. The percentage of high-earning households here is only slightly below Houston. The area is also responsible for more than 1,000 patents — perhaps not surprising for a place that’s part of one of the nation’s most vaunted innovation hubs, North Carolina’s Research Triangle.
Of course, the best place for any person to launch a career or a business depends on much more than the general characteristics we considered for this study. Someone looking to climb the ladder at a big financial firm will may want a different location than someone who plans to make his or her her first $1 million with a biotech startup. Still, these numbers offer some context around where the average person may have the best chance for success.
For some tips on how to make the most of that first big paycheck or venture funding round whenever it does come, check out the CreditDonkey guide to credit cards for business.
Sources used in this study:
- GDP by Metropolitan Area, 2011, U.S. Bureau of Economic Analysis
- Selected Economic Characteristics, U.S. Census Bureau, American Communities Survey 2011
- Patent Breakout by Origin, 2011, U.S. Patent and Trademark Office
Follow @CreditDonkey or write to Livia Gershon at livia@creditdonkey.com
For media inquiries or more information, contact charles@creditdonkey.com
For media inquiries or more information, contact charles@creditdonkey.com
MORE ARTICLES IN CREDIT CARD TIPS
Financial Tips for Young Adults
 Credit Card with Cosigner: Good, Bad, and Ugly of Cosigning
Credit cards can be a great way to establish a person’s credit history. But oftentimes, consumers are unable to qualify for a credit card on their own when they have no prior credit experience. They may need a cosigner to get them started.
| ||

No comments:
Post a Comment